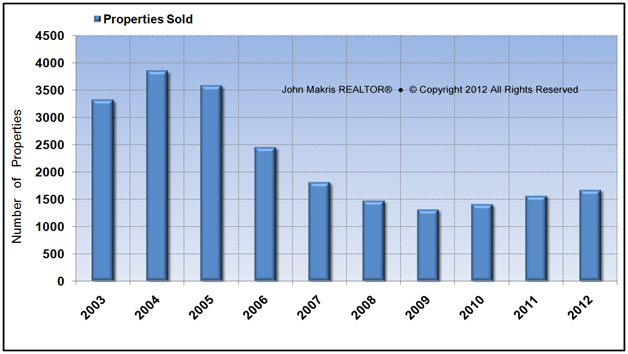
The Vero Beach real estate market was very active in 2012. Many more homes were sold in 2012 than in the previous year. The following sections provides a detail view of the Vero Beach mainland real estate market.
Real Estate Market Highlights
The real estate market in Vero Beach mainland was very active in 2012. The real estate market is strengthening between $250,000 and $350,000. The number of properties sold was the highest in 4 years while the inventory of available homes for sale was the lowest in 3 years, indicating an increase in demand as the following chart illustrates.  DATA SOURCE: IRC Tax Records & MLS data as of 1/3/2013. Data believed to be accurate but not guaranteed.
Despite the increase in sales and decrease in inventory, the pending sales is less than 50% and there are more than 9 months of remaining inventory in some areas in Vero Beach mainland, indicating that demand for homes does not keep up with supply in these areas.
 DATA SOURCE: MLS data as of 1/3/2013. Data believed to be accurate but not guaranteed.
The chart above shows that the inventory of available homes for sale has been declining, while the number of homes sold each month remains fairly steady, picking as expected in March through June due to seasonality
Real Estate Market Statistics
Notes: (1) This is the average of all 12 months of inventory & (2) This is the average DOM in 12 month period.
Real Estate Market Analysis
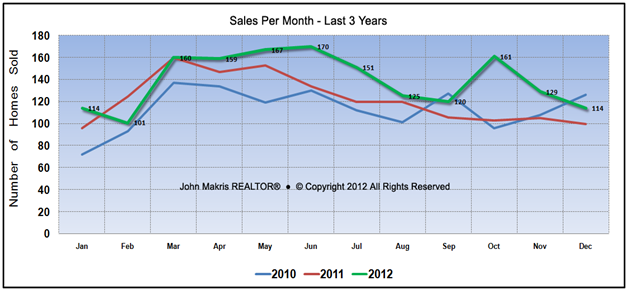
The month of December, 114 homes were sold in Vero Beach mainland and slightly fewer than the same month a year before. Overall, there were more sales this year that the previous 2 years, which is good news for the market moving forward. The chart below shows the trends of home sales during any given month and over 3 year period.  DATA SOURCE: MLS data as of 1/3/2013. Data believed to be accurate but not guaranteed.
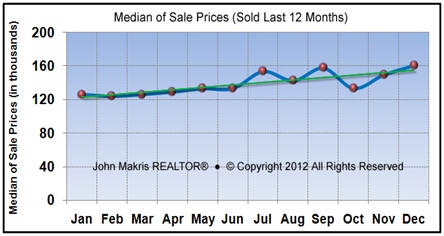
The median sold price for the last 30 days was $166,250 with an average DOM of 112 days. The sale prices have stabilized and are increasing. The median home price for homes in Vero Beach mainland was 11.5% higher in December 2012 than it was in December 2011 (see the chart below).
 DATA SOURCE: MLS data as of 1/3/2013. Data believed to be accurate but not guaranteed.
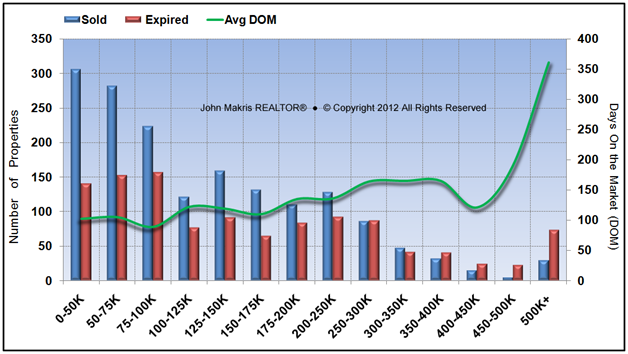
A Price Range analysis of homes sold versus homes that failed to sell (expired) and the days these homes were on the market (DOM) provides a useful statistic for the overall health of the Vero Beach mainland real estate market. The chart below presents the number of homes Sold vs. Expired (failed to sell) the last 12 months (all of 2012) and DOM of homes sold. Notice that homes in the $75K to $100K price range were sold the fastest with an average of 89 DOM.
 DATA SOURCE: MLS data as of 1/3/2013. Data believed to be accurate but not guaranteed.
Detailed Real Estate Market Reports for Vero Beach mainland are produced on a monthly basis. If you would like to receive these real estate market reports, fill in the request form below with your email address and indicate that you wish to receive market reports in the message box. These reports will be sent to your email the beginning of the each month with market statistics of the previous month.

[…] throughout 2012. Demand was particular strong for homes priced below $200,000 (see more details in Vero Beach Mainland Real Estate Market Report December 2012). Real Estate Market AnalysisThe Vero Beach real estate market for both single family homes and […]