The Vero Beach Real Estate Market for single family homes the island in December 2017 got rejuvenated with more sales than the same period on 2016. Sale prices have stabilized for now and sit at the same level as last year. Demand for high-end single family homes on the island continues.
Vero Beach Real Estate Market Highlights – December 2017 2017
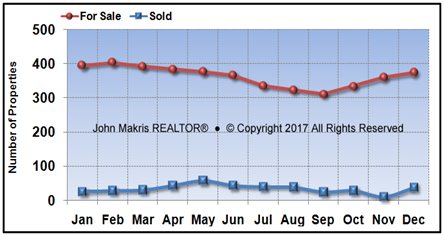
Sales increased by 32% in December 2017 compared to last year and almost tripled compared to the anemic sales in November. This month 37 homes were sold on the island, however inventory is also increasing as shown in the chart below.
 DATA SOURCE: MLS data as of 1/2/2018. Data believed to be accurate but not guaranteed.
The increase in sales this month is a welcoming sign for the market as we enter the seasonally active winter season of 2018..
Vero Beach Real Estate Market Statistics – December 2017 2017
 DATA SOURCE: MLS data as of 1/2/2018. Data believed to be accurate but not guaranteed.
Notes: (1) The average of all 12 months of inventory, (2) The average of all 12 months of List Price to Sale Price Ratio & (3) The average DOM in 12 month period.
The Vero Beach real estate market report for December 2017 shows that the market was more active this month as sales of single family homes on the island increased compared to last year and last month. The List to Sale price ratio of 90.3% is below the average and increasing indicating that buyers are still willing to bid for homes on the island.
The Days On the Market (DOM) is slightly above average indicating steady demand for single family homes on the island.
The Absorption Rate, or months of inventory of 10.1indicates that we are in a buyers market.
Vero Beach Real Estate Market Analysis – December 2017 2017
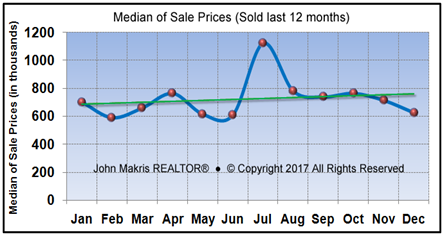
Sale prices are flat and at the same level as in the same period last year and the median of sale prices was $625,000. The jump in sale prices in July was mainly due to multiple sales of high-end homes as the following charts shows.
 DATA SOURCE: MLS data as of 1/2/2018. Data believed to be accurate but not guaranteed.
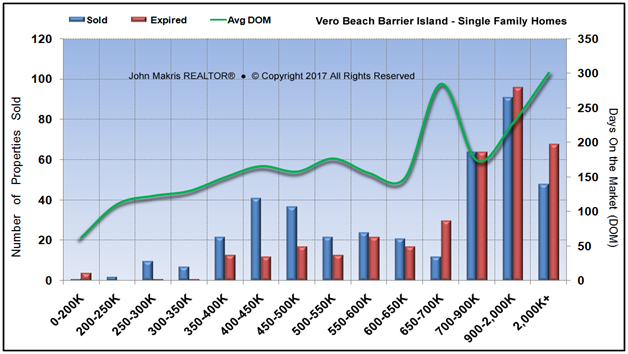
An analysis on Price Ranges of homes sold versus homes that failed to sell (expired) and the days these homes were on the market (DOM) gives us a good indication for the overall health of the real estate market on the barrier island (zip code 32963) in Vero Beach. The Vero Beach real estate market chart below presents the number of single family homes Sold vs. Expired (failed to sell) the last 12 months and DOM of homes sold.
 DATA SOURCE: MLS data as of 1/2/2018. Data believed to be accurate but not guaranteed.
More homes sold than expired in some price ranges but the trend is changing on higher price ranges. Homes above $2M took the longest to sell with 301 DOM.
Sale prices have stabilized for now but sellers are still asking for higher prices. This action is creating a price to value imbalance.
Detailed Real Estate Market Reports for single family homes in Vero Beach Barrier Island (zip code 32963) are provided to my clients. These reports offer market insights and market statistics. If you are interested in Vero Beach real estate, use the request form below or call me at 772-532-0945.
For buyers I provide detailed market analysis specific to each area. For sellers, I can provide a complimentary no-obligation property price analysis consultation and use the request form below for your request.