A review of the Vero Beach Real Estate market in 2024 started strong for most areas as they were in a Sellers Market the 1st half of the year, but the market softened in the 2nd half with single family homes faring better than condos in both barrier island and in mainland as buyers were actively looking for a home in Vero Beach Florida.
However, the continued high interest rates affecting mortgage rates, the increase in home prices, affected the overall housing market, especially the second half of 2024. These market conditions also had an impact on the Vero Beach Real Estate Market as we’ll cover in the next sections.
Sales were below average on the barrier island and also on the mainland while inventory was increasing. Despite these issues, the sale prices kept increasing compared to last year for single family homes on the Barrier Island and mainland, but declined for condos on the island (zip 32963) in Vero Beach.
Overall in 2024 sales decreased by 7% compared to 2023 but the median of sale prices increased by 8% compared the same period last year. The moderate price increase can be attributed to decline in sale prices of condominiums in both the barrier island and mainland especially the last few months as the new law regarding reserve funds and required maintenance for condos over 3 stories near coastal areas.
Vero Beach Real Estate Market Analysis – Barrier Island
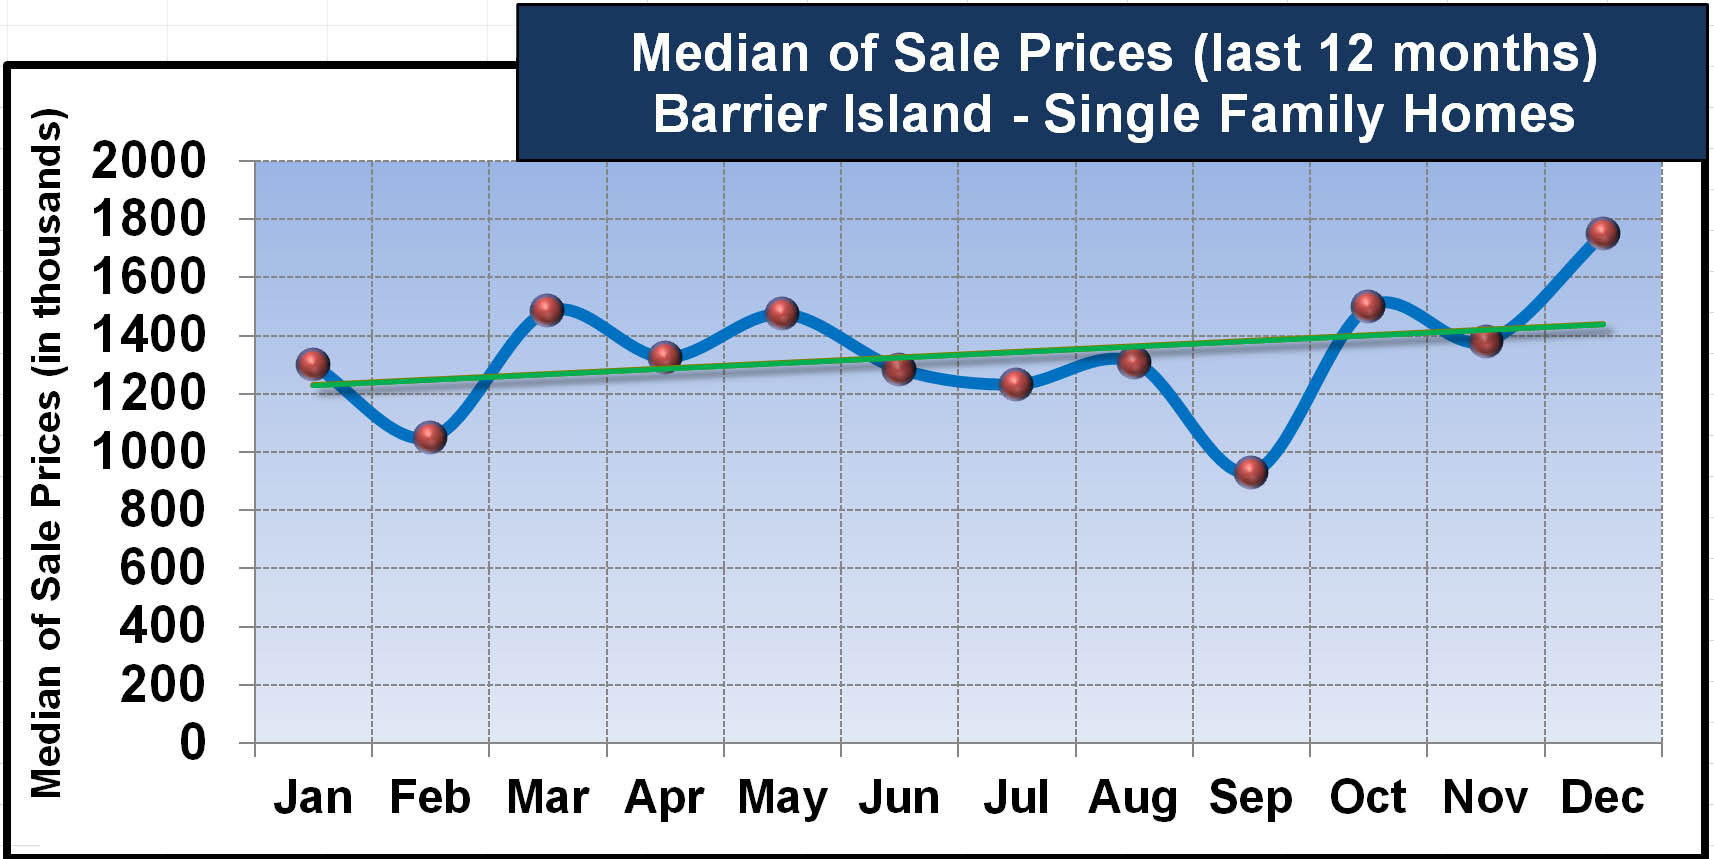
The following chart shows the median of sale prices in for Single Family Homes in Vero Beach Barrier Island for the whole 2024 year (January to December). The median of sale prices in December 2024 was $1,75,000 compared to $1,313,000 in 2023, an increase of 33% as shown in the chart below.
DATA SOURCE: MLS data as of 1/7/2025. Data believed to be accurate but not guaranteed.
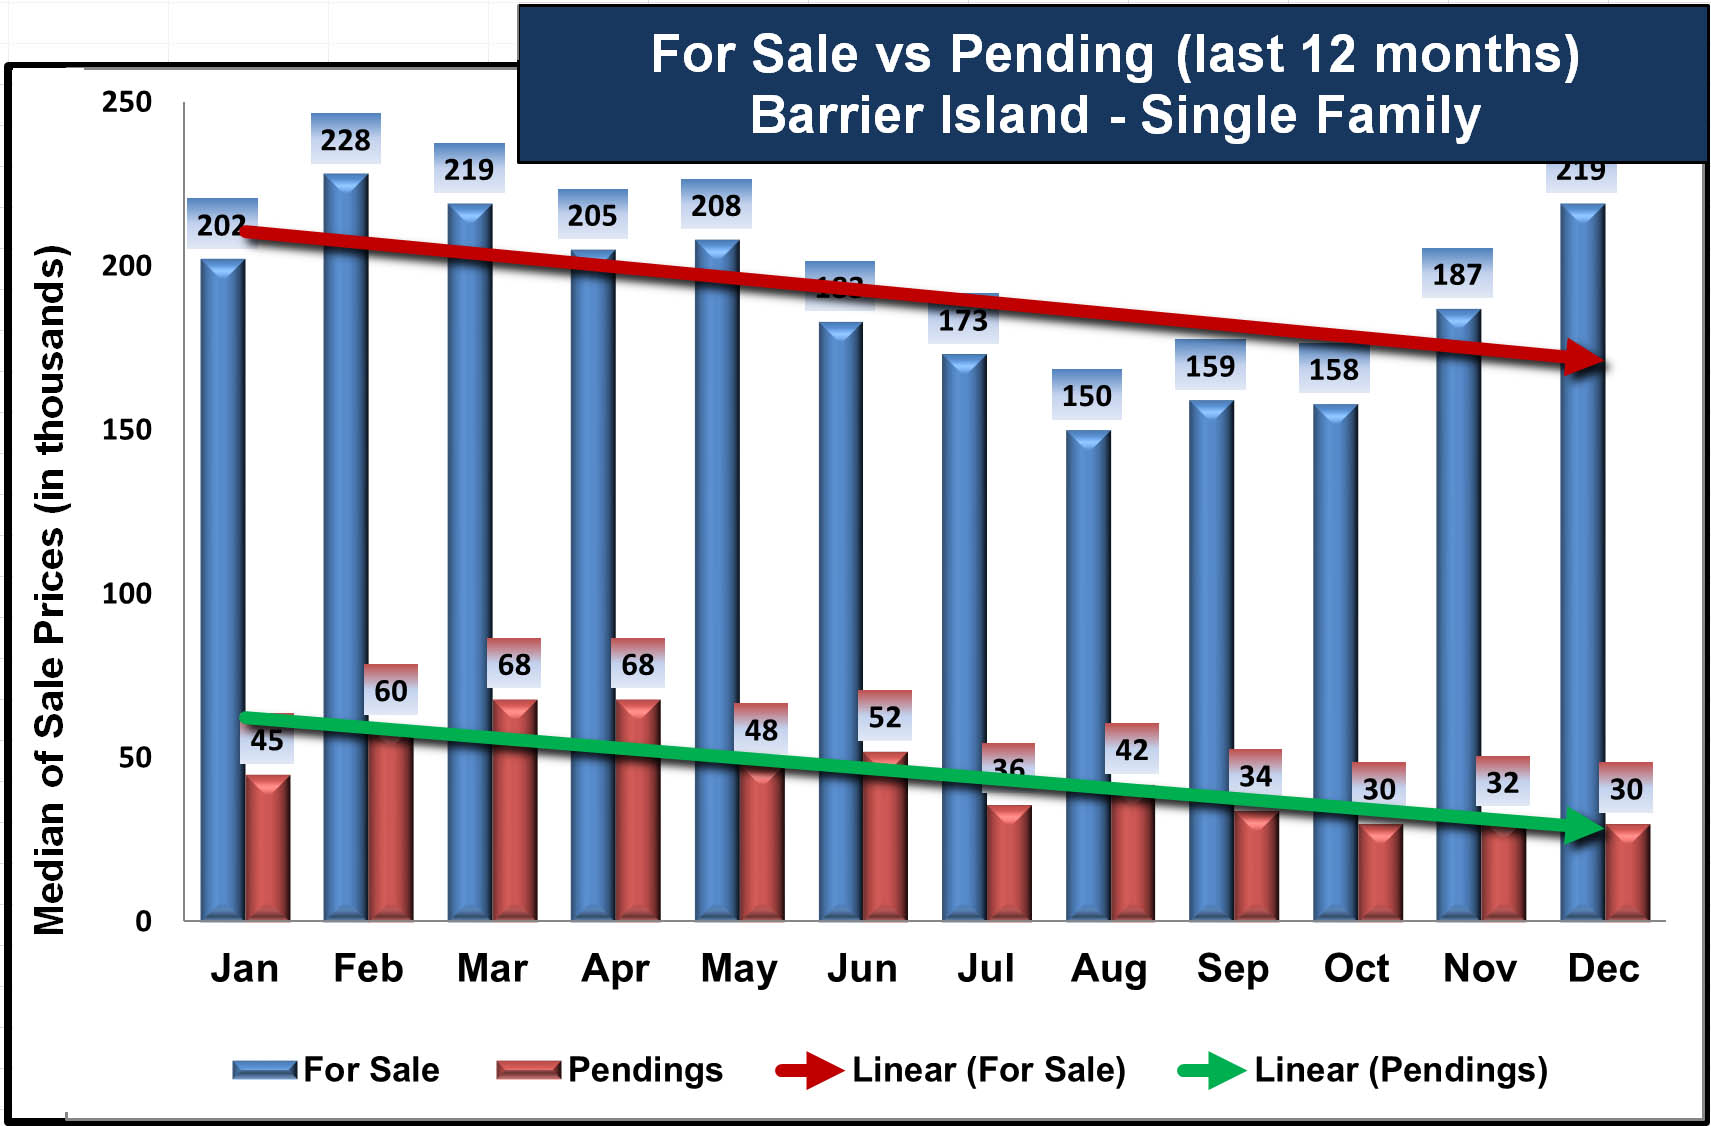
The reader can observe that the prices were trending up throughout almost 2024 as more high-priced single family homes were sold. It was noticeable the trend of the Inventory (homes for sale) to Sales ratio was widening towards the end of 2024 as more single family homes were available for sale but fewer homes were sold with a sales to inventory ratio of 88%.
The following chart of Single Family Homes for Sale versus Pending Sales clearly illustrates that the market for single family homes on the barrier island was softer in 2024 than 2023.
DATA SOURCE: MLS data as of 1/7/2025. Data believed to be accurate but not guaranteed.
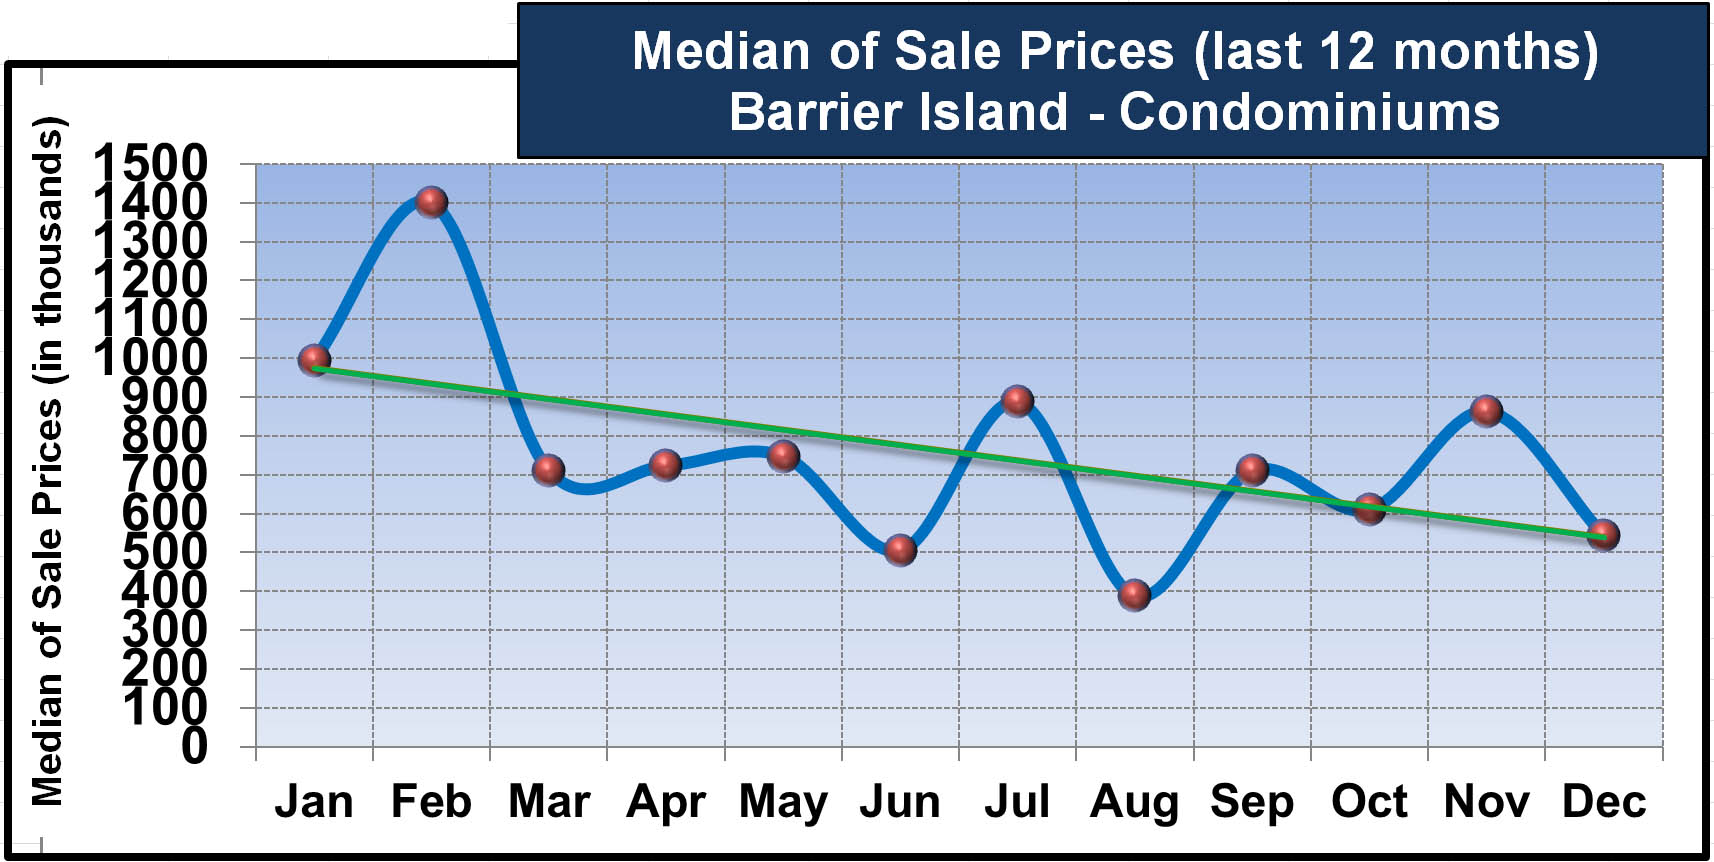
Let’s now look at the following chart of the median of sale prices for Condos in Vero Beach Barrier island for the whole 2024 year (January to December). The median of sale prices in December 2024 was $543,000 compared to $688,000 in 2023, an decline of 21% as shown in the chart below.
DATA SOURCE: MLS data as of 1/7/2025. Data believed to be accurate but not guaranteed.
The reader can observe that prices were trending down throughout 2024. It was also noticeable that the trend of the Inventory (condos for sale) to sales ratio was widening towards the end of 2024 as more condos were available for sale and fewer condos were sold.
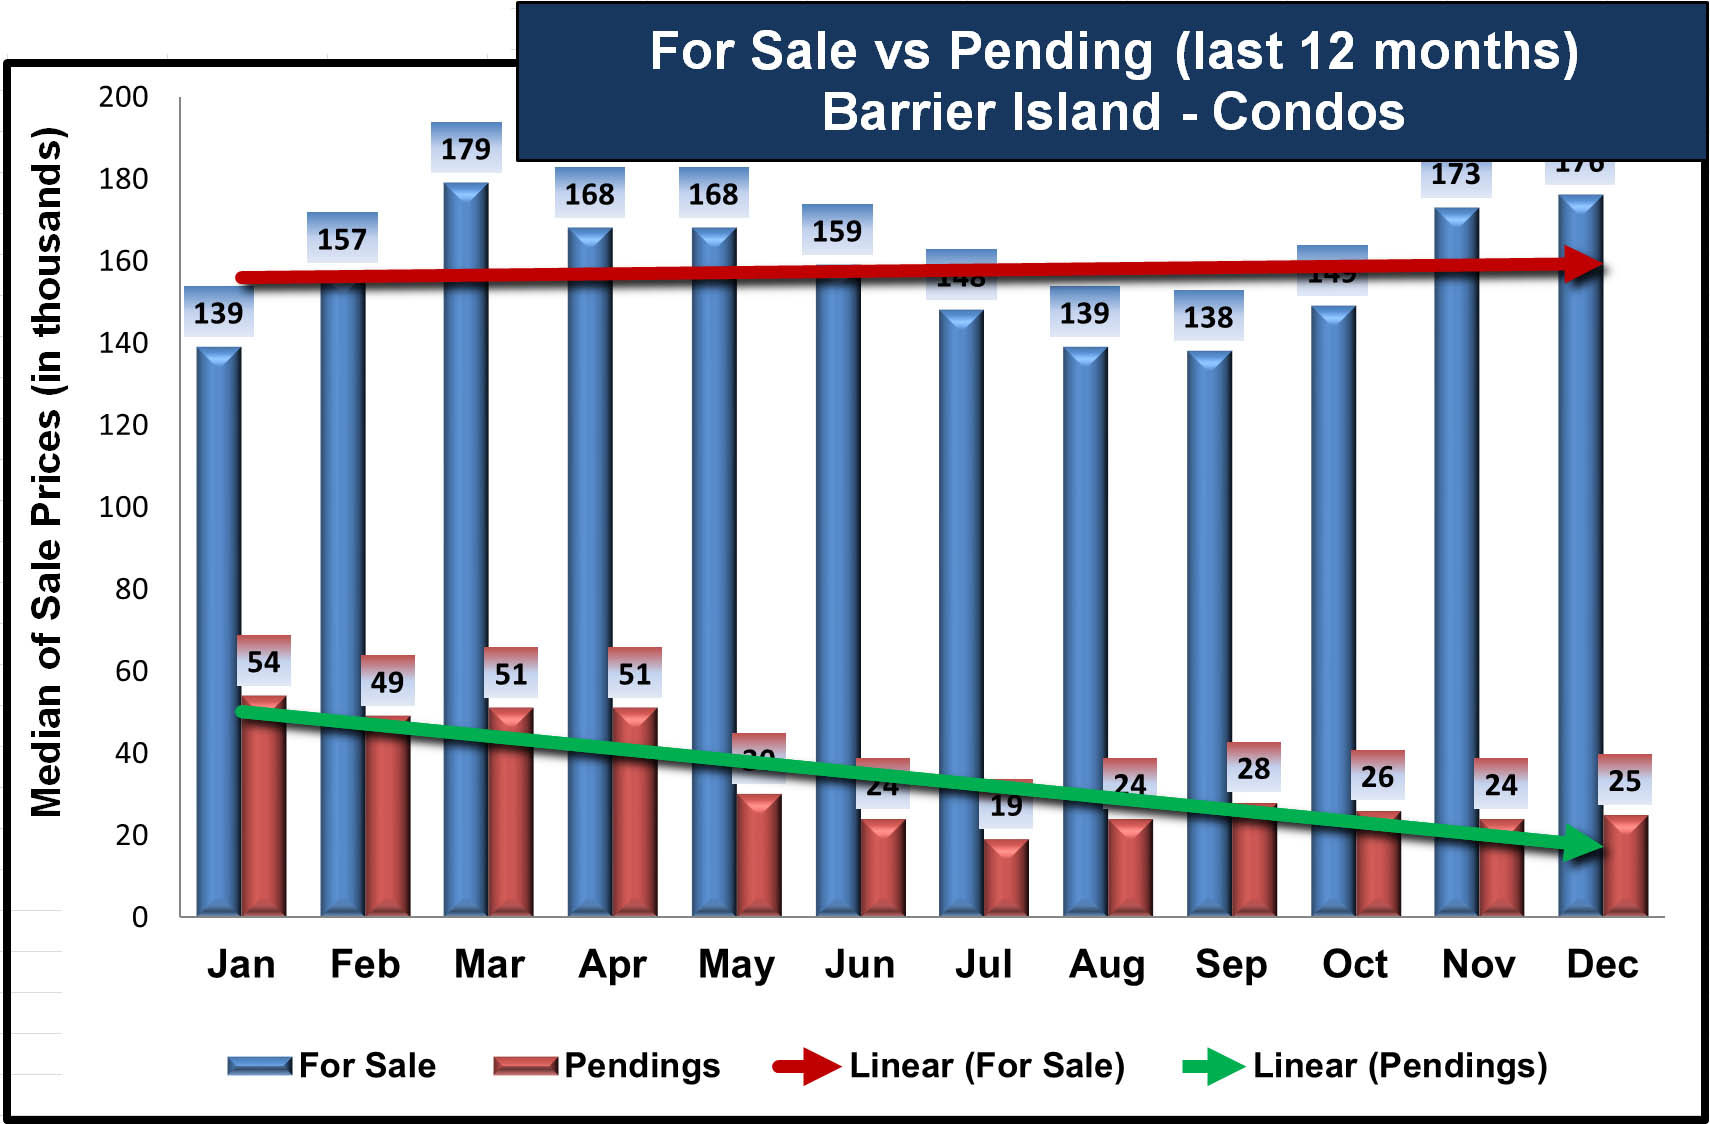
Similarly to the chart of Single Family Homes for Sale versus Pending Sales, the following chart for Condos on the barrier island clearly shows this divergence showing the market shift.
DATA SOURCE: MLS data as of 1/7/2025. Data believed to be accurate but not guaranteed.
Vero Beach Real Estate Market Analysis – Mainland
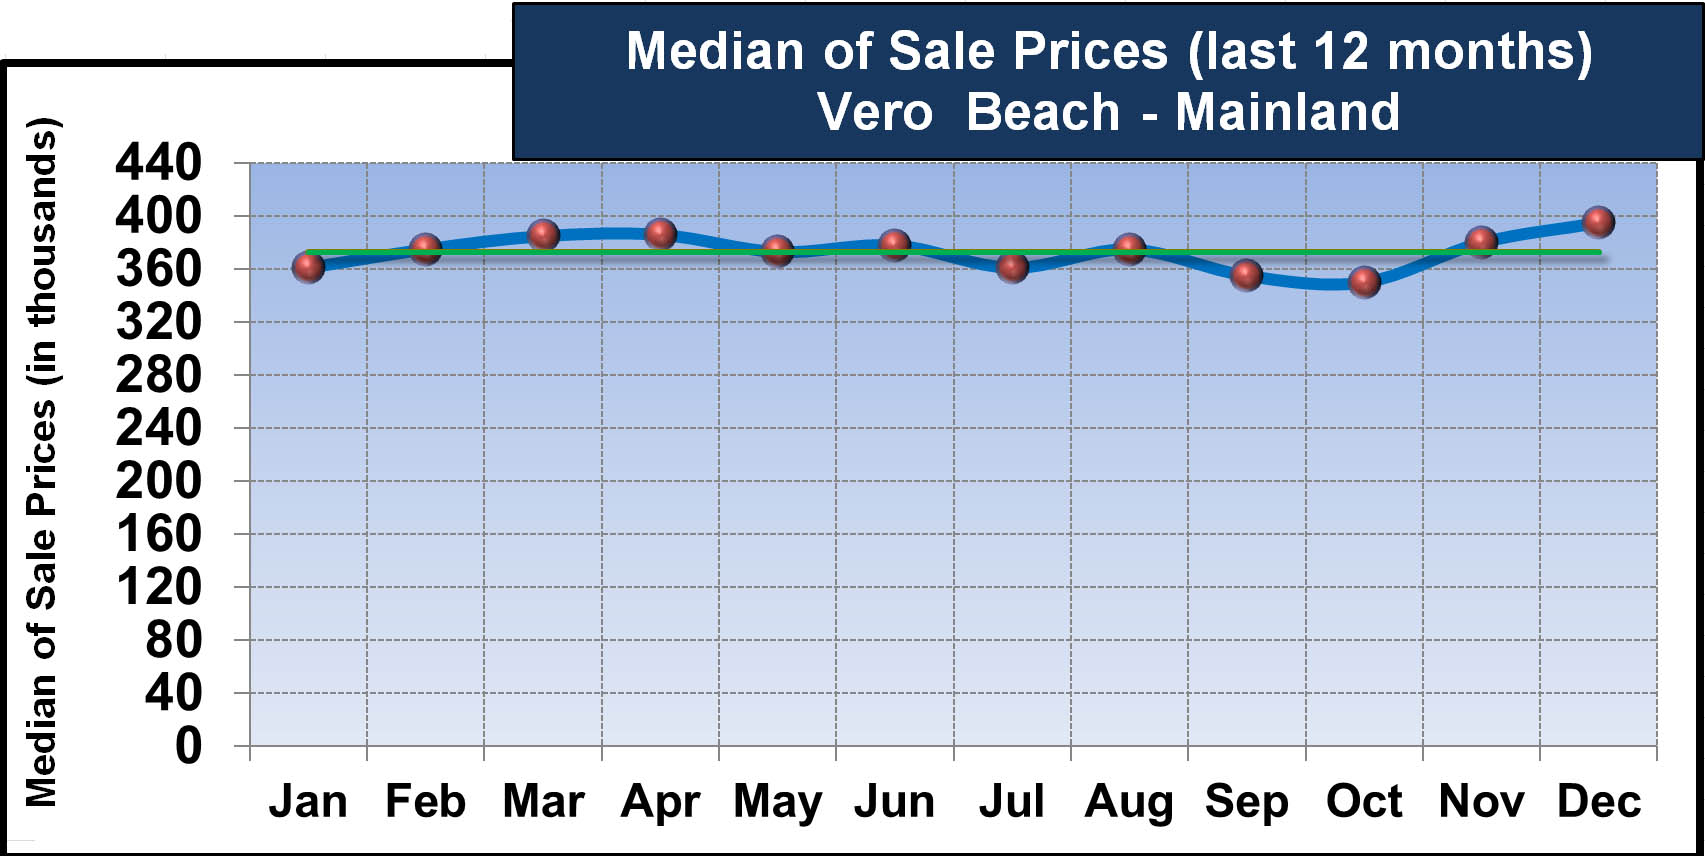
Sale prices in Vero Beach mainland continue to appreciate and increased by 13% in December 2024 compared to the same period in 2023 with a median sale price of $395,000 . The chart below of the median of sale prices in Vero Beach Mainland Real Estate Market shows that sale prices were trending up throughout 2024.
DATA SOURCE: MLS data as of 1/7/2025. Data believed to be accurate but not guaranteed.
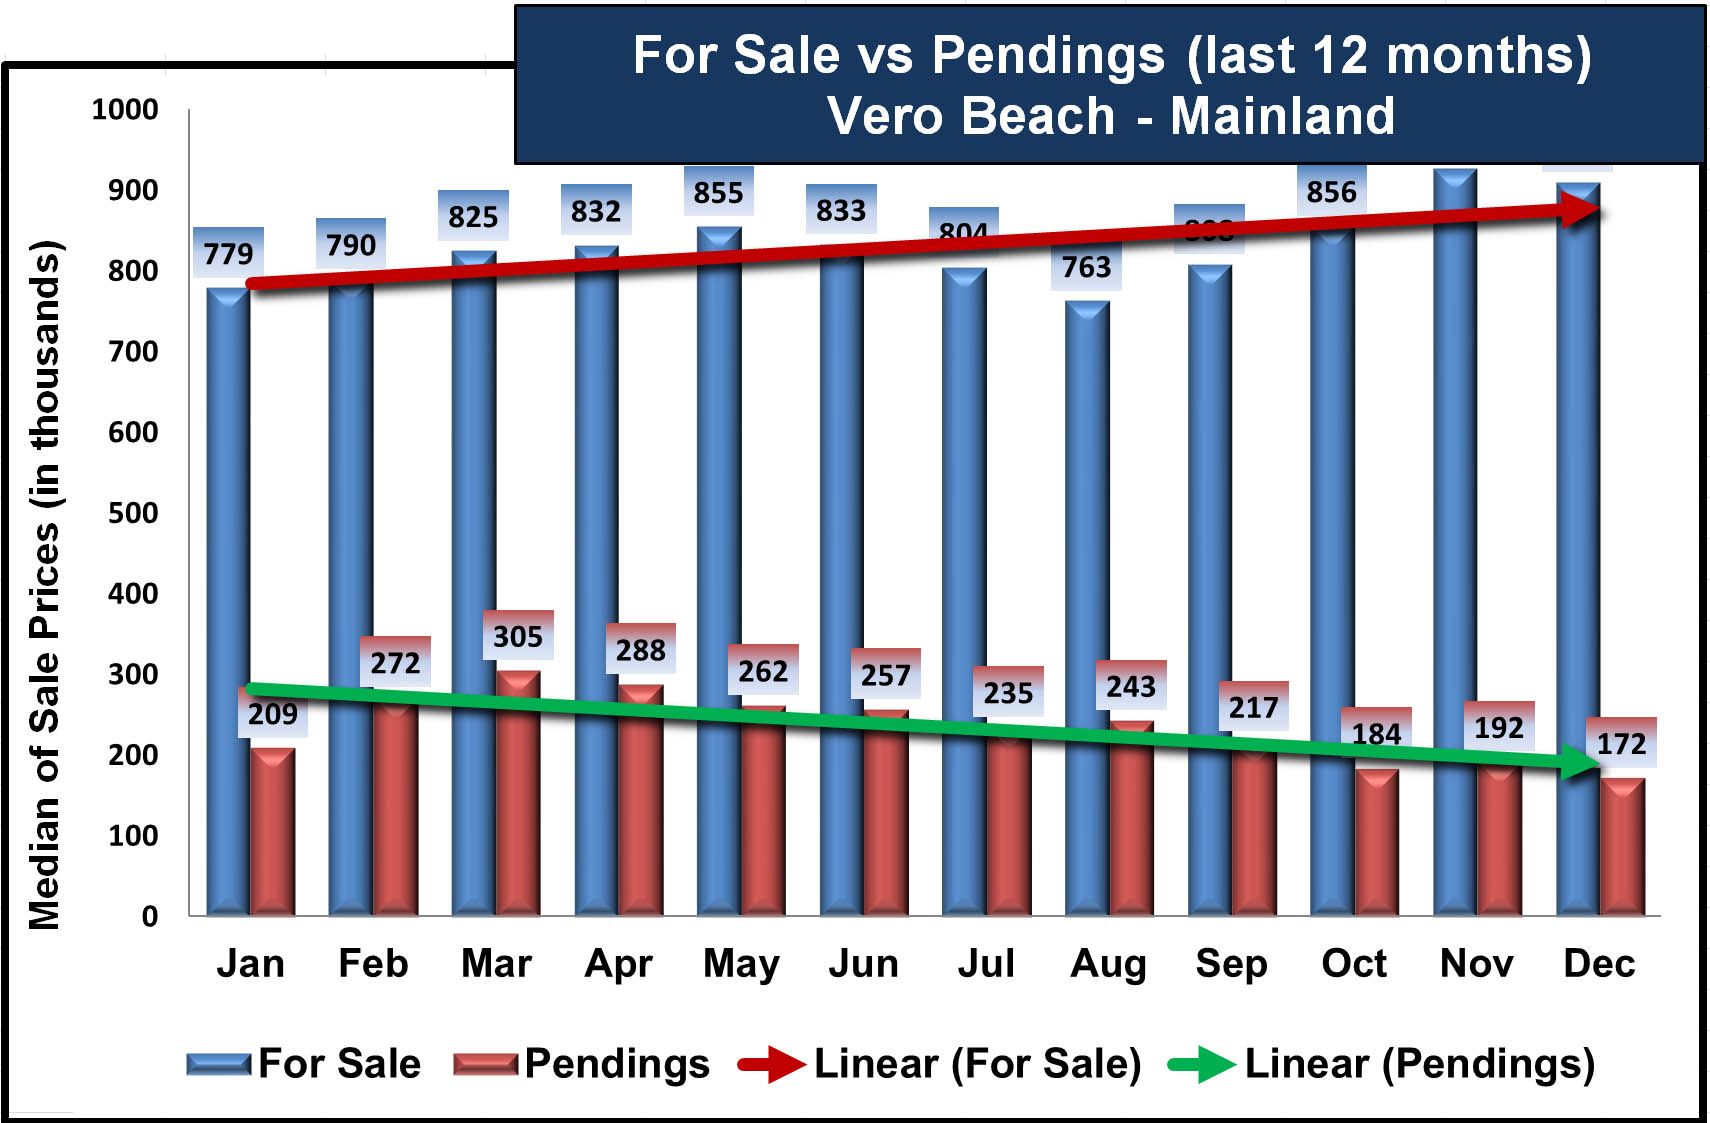
The above chart shows a steady increase in sale prices throughout 2024 for homes in Vero Beach Mainland. Like the Vero Beach barrier island, the trend of Homes for Sale to Sales ratio is widening towards the end of 2024 as more Vero Beach Mainland homes were available for sale and fewer homes were sold.
Similarly to the other charts of Homes for Sale versus Pending Sales, the following chart for homes on the mainland clearly shows this divergence showing the market shift by observing the “Linear for Sale” arrow pointing up while the “Linear Pending” arrow is pointing down.
DATA SOURCE: MLS data as of 1/7/2025. Data believed to be accurate but not guaranteed.
Overall Housing Market – December 2024
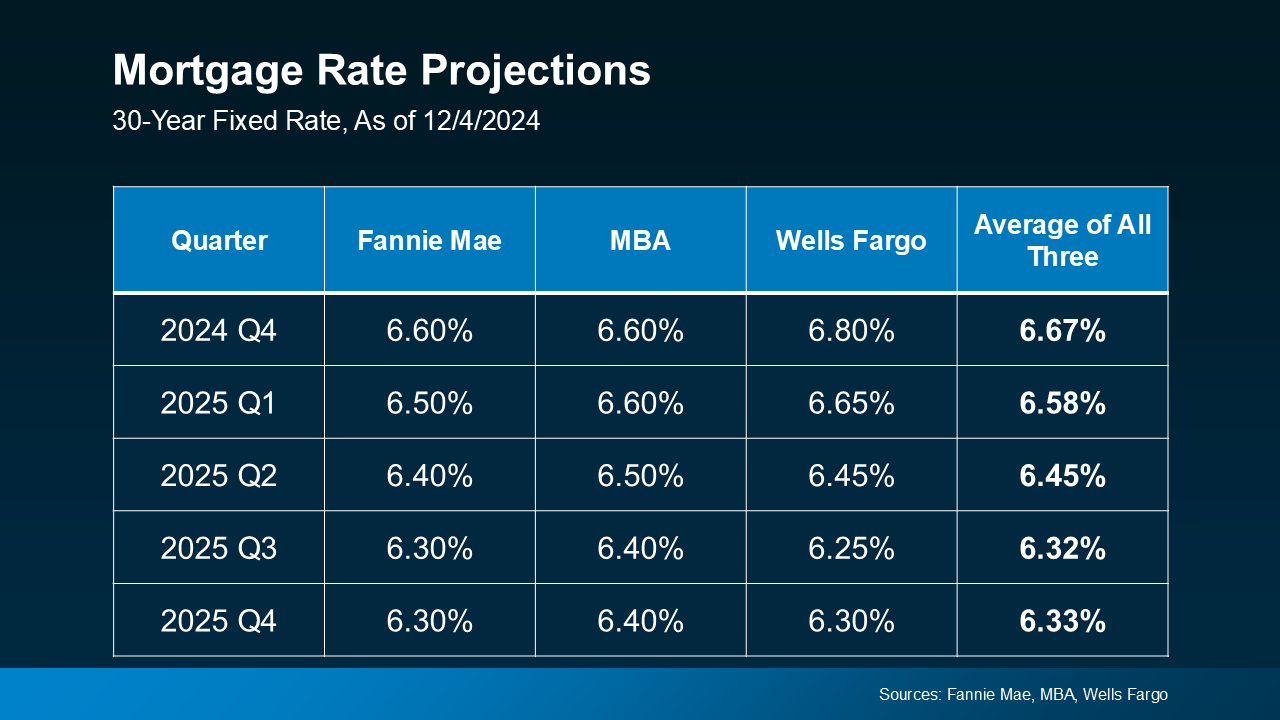
Mortgage rates increased dramatically in 2022 due to FED’s tightening effort. However, the experts expect that rates will stabilize and start to decline in 2025 as the following chart shows.
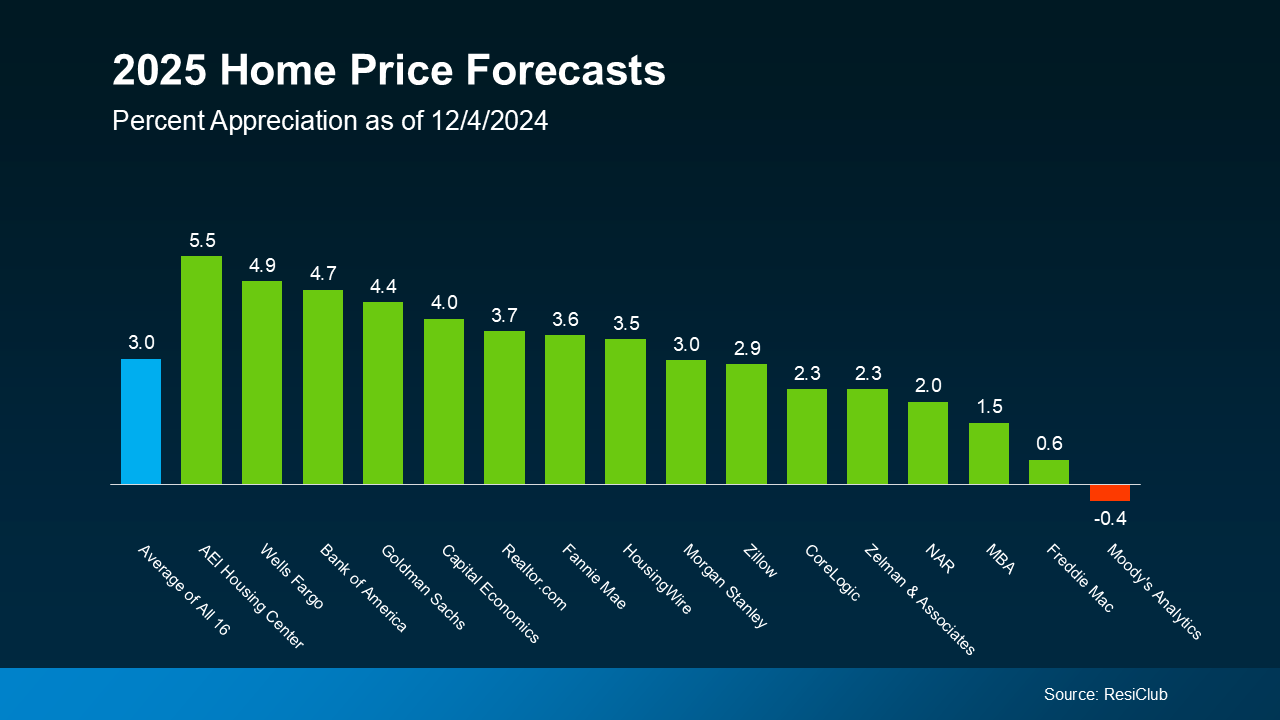
Home Sale Prices are expected to level off in 2025 but some experts still showing a slight deceleration of home prices as the following charts shows.
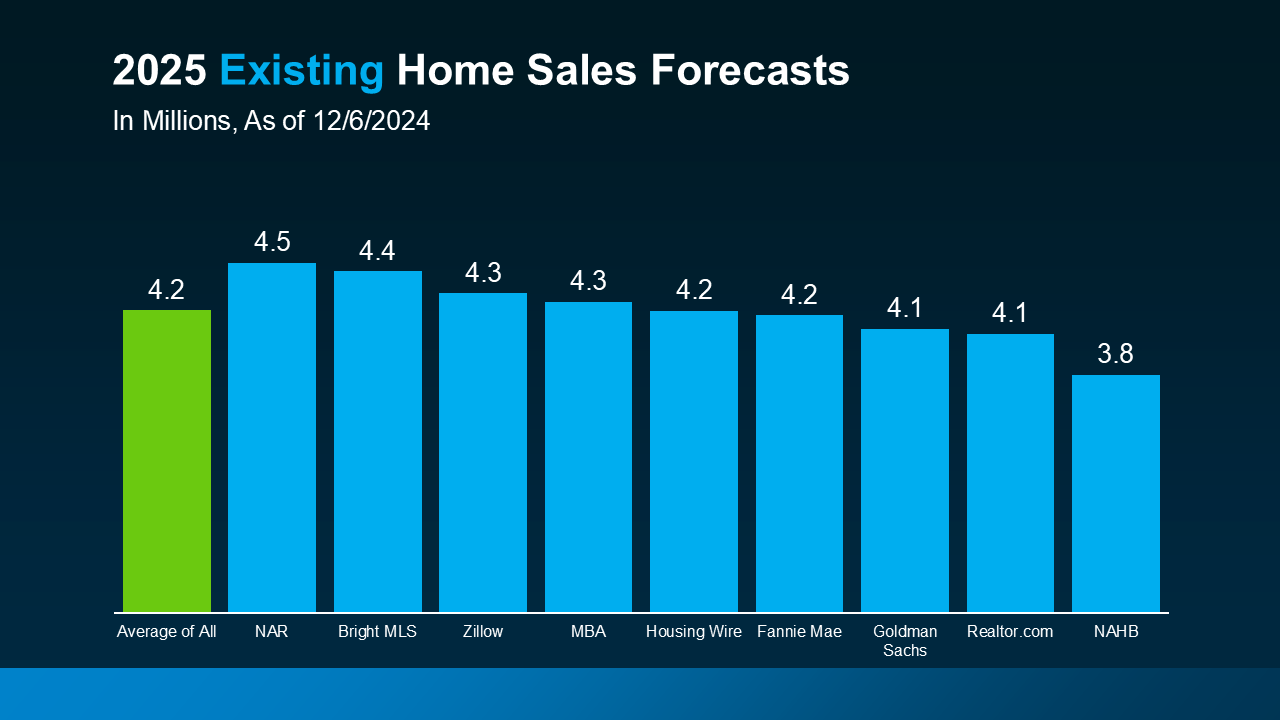
Existing Home Inventory levels are expected to increase in with an average estimated increase of 4.2% as the following graph shows.
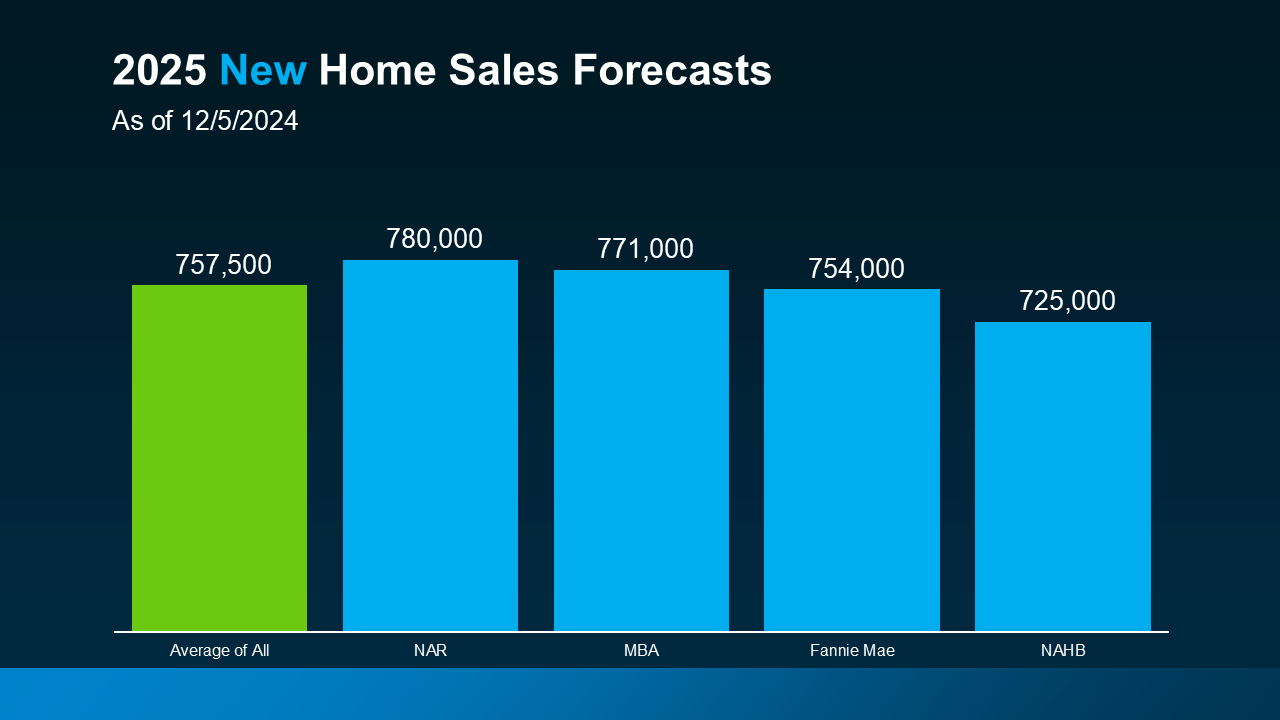
Here in Vero Beach we will expect a continuing increase in inventory as the winter season gets under way (review the latest Vero Beach Real Estate Market Reports here). The following chart shows the New Homes Sales forecast for 2025.
New construction in several communities in Vero Beach continues on the mainland and but limited on the island.
Detailed Vero Beach Real Estate Market Reports for specific areas or neighborhoods are provided to my clients. These reports offer local market insights and market statistics. If you are interested in Vero Beach real estate, use the request form below or call me at 772-532-0945.
For buyers I provide detailed market analysis specific to each area. For sellers, I can provide a complimentary no-obligation property price analysis consultation. Please use the request form below or call me directly at 772-532-0945.
Vero Beach Real Estate Services Form:
"*" indicates required fields