The Vero Beach real estate market October report for single family homes on the barrier island shows a stagnant market with slight price depreciation compared to last month. The demand has also cooled off. However, there are price points where the demand is greater that the supply, and a seller’s market.
The following sections provide a detail view of the Vero Beach real estate market on the Barrier Island (zip code 32963) for single family homes.
Vero Beach Real Estate Market Highlights
Total home sales for October 2013 were slightly higher than the same time last year and higher than 2010 and 2011. Median of sale prices fell from the same period in 2012. The pending sales ratio is still less than 50% and months of remaining inventory is above 9 in all areas, meaning we are still in a buyer’s market.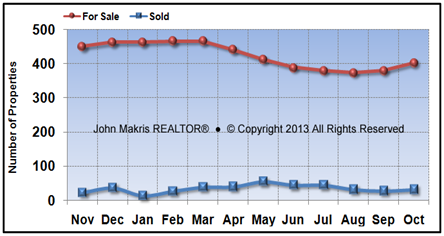 DATA SOURCE: MLS data as of 11/2/2013. Data believed to be accurate but not guaranteed.
We can see from the chart above that the inventory is increasing the last 2 months indicating that more sellers have taken advantage of the recent market activity and have decided to enter the market. We need to see more decrease in inventory levels and increased demand for more price appreciation.
Vero Beach Real Estate Market Statistics
 DATA SOURCE: MLS data as of 11/2/2013. Data believed to be accurate but not guaranteed.
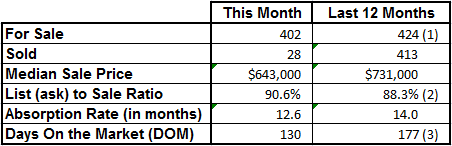
Notes: (1) This is the average of all 12 months of inventory, (2) This is the average of all 12 months of List Price to Sale Price Ratio & (3) This is the average DOM in 12 month period.
Vero Beach real estate market report shows that the List (asking price) to Sale Price ratio is a useful statistic that shows the strength of a particular real estate market. The closer the sale price to list or asking price, the stronger the market is.
The real estate market for single family homes on the barrier island In Vero Beach shows a list to sale ratio of 90.6% , indicating that homes are priced closer to the market and the buyers are willing to make offers closer to the asking price.
Vero Beach Real Estate Market Analysis
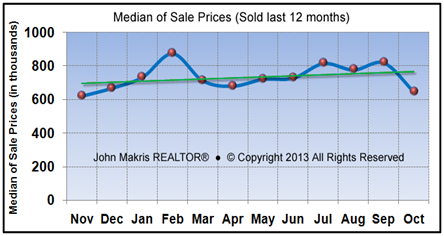
In October 32 single family homes were sold on the island in Vero Beach, a 14.3% increase from the previous month. The recent increases in mortgage rates may have started affecting sales. Fall is a slow time for Vero Beach real estate market, but we are keeping a close eye on the recent mortgage activity and interest rate increases for possible impact on the housing recovery.Median of sale prices declined by 21.3% from the previous month . The median sold price for the last 30 days was $643,000 with an average of 130 Days On the Market (DOM). The high DOM number indicates that demand for single family homes on the island is waning, but the sale prices are starting to stabilize and appreciate (see the chart below).
 DATA SOURCE: MLS data as of 11/2/2013. Data believed to be accurate but not guaranteed.
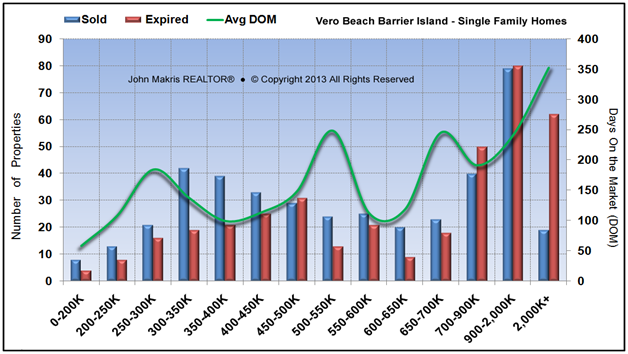
A Price Range analysis of homes sold versus homes that failed to sell (expired) and the days these homes were on the market (DOM) provides a useful statistic for the overall health of the real estate market on the barrier island (zip code 32963) in Vero Beach. The Vero Beach real estate market chart below presents the number of single family homes Sold vs. Expired (failed to sell) the last 12 months and DOM of homes sold.
 DATA SOURCE: MLS data as of 11/2/2013. Data believed to be accurate but not guaranteed.
Notice that homes below $200,000 and in the $350,000 to $400,000 price range were sold the fastest with an average of 58 and 99 DOM respectively.
More Vero Beach single family homes failed to sell (expired) than sold in $450,000 to $500,000 and above $700,000 price range. Homes above $2 Million took the longest to sell with 352 DOM. Homes may expire for many reasons such as being priced too high, inadequately marketed, or owner decided not to sell.
The real estate market for single family homes on the barrier island has cooled off. However, there are price points where the demand is greater that the supply, and a seller’s market. Subscribe to the detailed market report below to see the hottest markets and price points.
Detailed Real Estate Market Reports for single family homes in Vero Beach Barrier Island (zip code 32963) are produced on a monthly basis. If you would like to receive these real estate market reports, fill in the request form below with your email address. These reports will be sent to your email the beginning of the each month with market statistics of the previous month.
For sellers I provide detailed market analysis report specific to each area and a complimentary no-obligation price analysis consultation.