The Vero Beach real estate is a tale of 2 markets; one on the mainland which remains strong and one on the barrier island which has softened the last couple of months. Although the real estate activity was at the same levels as last year, sale prices have started to decline. Overall, median of sale prices were decreased by 13.5% compared to the same period last yearas sale prices for condos and single family homes on the barrier island have retreated.
In August 2016 Vero Beach home sales slightly increased by 6% compared to the same period in 2015. Inventory in August 2016 also slightly declined as fewer homes were available for sale this month. The lack of inventory in some desirable locations and price ranges continues to affect sales.
Vero Beach Real Estate Market Highlights – August 2016
The Vero Beach real estate market is softening as sales decreased by 13.5% and Pending sales down by 11% compared to to the same period last year. Pending sales is a good forward indicator of market activity and this shows that the market has slowed down this 2016 summer season.
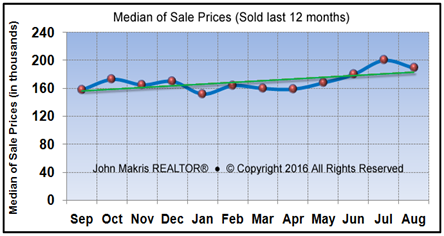
The Vero Beach real estate market activity and sale prices continue to vary by location and price range. Sale prices of homes in Vero Beach mainland continue to appreciate and increased by 26% compared to the same period last year (see the chart below of the median of sale prices in Vero Beach Mainland Real Estate Market for the last 12 months).
 DATA SOURCE: MLS data as of 9/2/2016. Data believed to be accurate but not guaranteed.
We saw seller’s market in all areas and price ranges for the first time all the way to $350,000 (see more details in Vero Beach Mainland Real Estate Market Report August 2016).
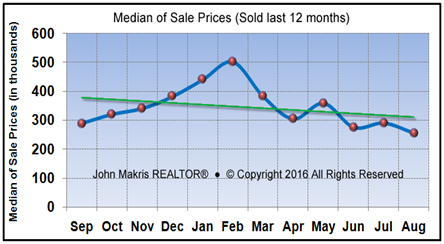
The real estate market for condos on the island in Vero Beach was very slow in August 2016 with much fewer sales and pendings compared to the same period in 2015. The anemic sales had an impact on the sales prices which were 17% lower than the same period in 2015 as shown in the following chart of the median of sale prices of condos in Vero Beach Barrier Island.
 DATA SOURCE: MLS data as of 9/2/2016. Data believed to be accurate but not guaranteed.
However, seller’s market continues below $300,000, in $350,000 to $450,000 and in the $600,000 to $650,000 price ranges (see more details in Vero Beach Barrier Island Condos Real Estate Market Report August 2016).
Vero Beach Real Estate Market Analysis – August 2016
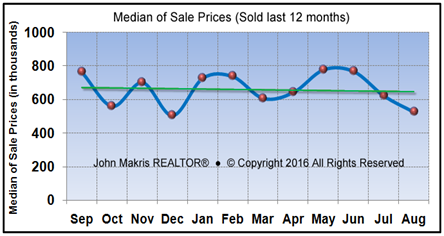
The real estate market for single family homes on the Vero Beach barrier island continue to slow down in August 2016 as sale prices have started to decline and were lower by 15.3% compared to the same period in 2015.
The following chart shows the price action and trend for single family homes in Vero Beach Barrier Island the last 12 months.
 DATA SOURCE: MLS data as of 9/2/2016. Data believed to be accurate but not guaranteed.
The lack of inventory in the $500,000 to $550,000 and the $600,000 to $650$650,000 price ranges continues to create a seller’s market (see more details in Vero Beach Barrier Island Single Family Real Estate Market Report August 2016).
Overall Housing Market – August 2016
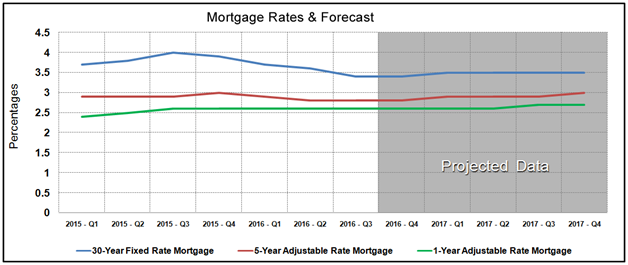
Mortgage rates continue to decline and have remained low for almost 7 months as the Fed is reluctant to raise interest rates in the near future due to economic uncertainties. The projections by the experts show that the rates will remain at low levels all the way to 2017, which is great news for buyers of Vero Beach real estate who should not hesitate to make offers as inventory is getting lower and demand is steady.
 DATA SOURCE Fannie Mae: Economic and Strategic Research; Mortgage Rates Forecast – August 2016.
The chart below shows the Fannie Mae Existing Home Sales for Single Family Homes, Condos and Co-Ops from 2015 to present and the projections for all of 2016 and 2017.
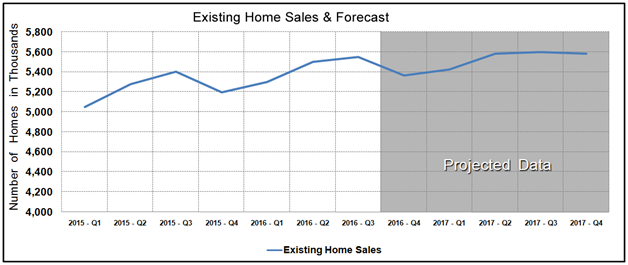 DATA SOURCE Fannie Mae: Economic and Strategic Research; Existing Home Sales & Forecast – August 2016.
There is little change in this chart since last month. The market activity for existing homes remains constant as inventory levels are projected to stay at the same levels all the way to 2017. The Vero Beach real estate market remains active for homes on the mainland but the lack of inventory in some price ranges and locations on the barrier island is affecting sales and sale prices.
The chart below shows the Fannie Mae new housing starts and Sales Forecast for Single Family Homes from 2015 to present and the projections to end of 2017
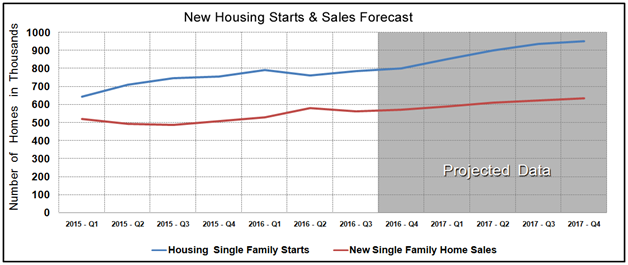 DATA SOURCE Fannie Mae: Economic and Strategic Research; Housing Starts Forecast – August 2016.
Demand for new construction is intact and this trend continues into 2017 with some projections showing acceleration in new housing starts as demand for homes is still strong.
Detailed Vero Beach Real Estate Market Reports are produced on a monthly basis. If you would like to receive real estate market reports of your area, Vero Beach Mainland or Vero Beach Barrier Island (single family homes or condos), fill in the request form below with your email address and specify the area of interest in the message box. These reports will be sent to your email the beginning of the each month with market statistics of the previous month.