The Vero Beach real estate market activity on the mainland in December 2017 continues strong with more sales and higher prices than the same period last year. However, appreciation in sale prices has slowed down and appears that have stabilized . The inventory continues to decline and the steady demand for homes in Vero Beach mainland may keep pushing sale prices even higher as we enter the traditionally active winter season.
Vero Beach Real Estate Market Highlights – December 2017
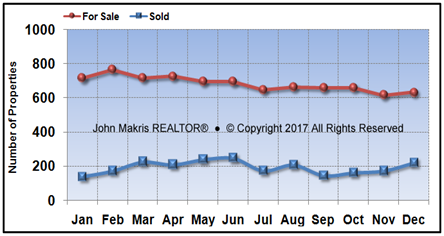
In December 2017, 220 homes were sold in Vero Beach mainland, 25% more than the same period in 2016 and more than in November. Sales have recovered since hurricane Irma as demand for homes on the mainland remains strong and the migration of barrier island residents to the mainland continues.
 DATA SOURCE: MLS data as of 1/2/2018. Data believed to be accurate but not guaranteed.
The chart above shows that the inventory continues to decline the last few months decreased by 7% compared to last year. In December 2017, 220 homes were sold in Vero Beach mainland, 25% more than the same period in 2016. The low inventory levels along with increased demand for homes on the mainland continue to drive sale prices up.
Vero Beach Real Estate Market Statistics – December 2017
 DATA SOURCE: MLS data as of 1/2/2018. Data believed to be accurate but not guaranteed.
Notes: (1) The average of all 12 months of inventory, (2) The average of all 12 months of List Price to Sale Price Ratio & (3) The average DOM in 12 month period.
In December 2017, the absorption rate or months of remaining inventory was 2.9 indicating that we are still in the sellers market for Vero Beach mainland homes.
The list to sale price ratio (96.8%) is higher with the average and keeps increasing indicating strong demand and market activity.
Vero Beach Real Estate Market Analysis – December 2017
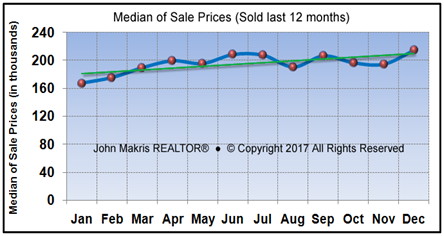
The chart below shows that sale prices continue to increase and this month’s 23% increase compared to 2016 shows that demand for homes on the mainland is still strong. Sellers market continues for all price ranges up all the way up to $500,000.
 DATA SOURCE: MLS data as of 1/2/2018. Data believed to be accurate but not guaranteed.
The median of sale prices for the last 30 days was $2140,000 with an average DOM of 94 days. The low inventory levels may continue to drive up demand and sale prices.
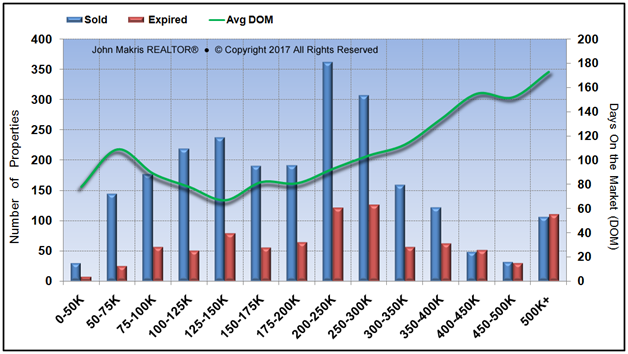
An analysis on Price Ranges of homes sold versus homes that failed to sell (expired) and the days these homes were on the market (DOM) gives us a good indication for the overall health of the real estate market on the barrier island (zip code 32963) in Vero Beach. The Vero Beach real estate market chart below presents the number of single family homes Sold vs. Expired (failed to sell) the last 12 months and DOM of homes sold.
 DATA SOURCE: MLS data as of 1/2/2018. Data believed to be accurate but not guaranteed.
Homes up to $200,000 price range were sold the fastest with an average of 83 DOM. Homes in over $500K took the longest to sell with 173 DOM.
Sale prices keep increasing as strong demand and low inventory may keep pushing prices higher as we enter the traditionally active winter season of 2018.
Detailed Real Estate Market Reports for Vero Beach Mainland are provided to my clients. These reports offer market insights and market statistics. If you are interested in Vero Beach real estate, use the request form below or call me at 772-532-0945.
For buyers I provide detailed market analysis specific to each area. For sellers, I can provide a complimentary no-obligation property price analysis consultation and use the request form below for your request.