The Vero Beach real estate market report shows that in mainland the market is still very active but is cooling off. We have are seeing weakness in previously healthy markets and price points. The market is still active for homes priced below $150,000. The following sections provide a detail view of the Vero Beach mainland real estate market.
Vero Beach Real Estate Market Highlights
Median of home values have increased 13% from a year ago in Vero Beach mainland, and a seller’s market in some price ranges.. Inventory (homes available for sale) has declined, but we saw a jump of 15% in inventory this month. The Pending Ratio (for Sale vs. Pendings) is above 50% in some price ranges which means that demand is steady and price appreciation expected to continue the rest of the year for these price points.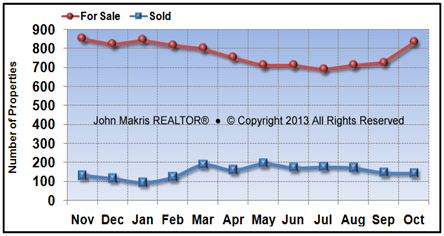 DATA SOURCE: MLS data as of 11/2/2013. Data believed to be accurate but not guaranteed.
The chart above shows that the inventory of available homes for sale in Vero Beach mainland has been declining since the beginning of 2013, but it is increasing the last 3 months. Total home sales for October 2013 were 12.5% lower than the same month in 2012. Inventory also increased by 15% from September and reached the same level as the same period last year.
Vero Beach Real Estate Market Statistics
 DATA SOURCE: MLS data as of 11/2/2013. Data believed to be accurate but not guaranteed.
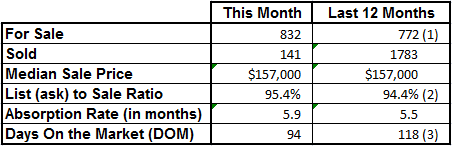
Notes: (1) This is the average of all 12 months of inventory, (2) This is the average of all 12 months of List Price to Sale Price Ratio & (3) This is the average DOM in 12 month period.
The List (asking price) to Sale Price ratio is a useful statistic that shows the strength of a particular real estate market. The closer the sale price to list or asking price, the stronger the market is.
In Vero Beach mainland, we see that the list to sale price ratio (95.4%) is increasing, the absorption rate, or months of inventory (5.0) has reversed order and started to increase indicating demand for homes in Vero Beach mainland is waning.
Vero Beach Real Estate Market Analysis
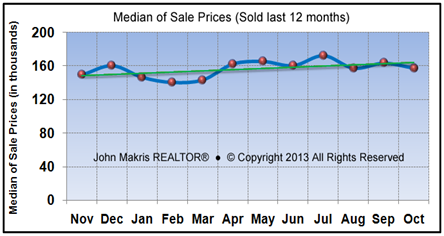
In October, 141 homes were sold in Vero Beach mainland. There were 832 homes available for sale with 268 pending contracts and a Pending Ratio of 32% and below the 50% threshold indicating demand is decreasing. This is an active market with price appreciation projected to continue the rest of the year, albeit at a slower pace.The median for the last 30 days was $157,000 with average days on the market (DOM) of 118 days. The sale prices are increasing. The Median of home values has increased 13% from a year ago and the trend shows that prices are still appreciating, but at a slower rate (see the chart below).
 DATA SOURCE: MLS data as of 11/2/2013. Data believed to be accurate but not guaranteed.
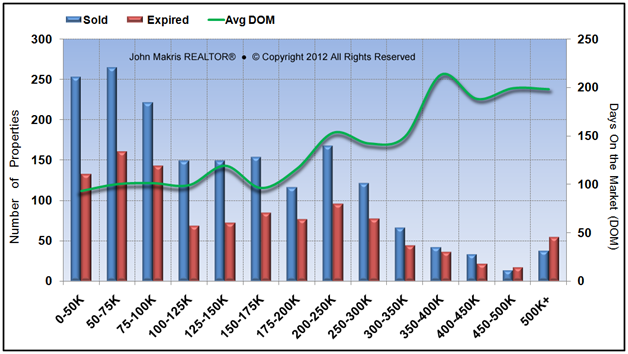
A Price Range analysis of homes sold versus homes that failed to sell (expired) and the days these homes were on the market (DOM) provides a useful statistic for the overall health of the Vero Beach mainland real estate market. The chart below presents the number of homes Sold vs. Expired (failed to sell) the last 12 months and DOM of homes sold. Notice that homes bellow $50K price range were sold the fastest with an average of 93 DOM.
 DATA SOURCE: MLS data as of 11/2/2013. Data believed to be accurate but not guaranteed.
More homes failed to sell (expired) above the $450,000 price range, than sold in Vero Beach mainland. Homes above 350,000 took the longest to sell with an average of 200 DOM. Homes may expire for many reasons such as being priced too high, inadequately marketed, in poor condition, or owner decided not to sell.
The market in Vero Beach mainland is still active but is cooling off. However, there are markets and price points that are still exhibiting strength..
The slight decrease in sales levels in October 2013 may be attributed to the recent mortgage rate increases and probably reduction in appetite for investment properties. We will monitor the market the next few months for any changes in the current trend and will alert the subscribers to Vero Beach real estate market reports.
Detailed Real Estate Market Reports for Vero Beach mainland are produced on a monthly basis. If you would like to receive these real estate market reports, fill in the request form below with your email address and indicate that you wish to receive market reports in the message box. These reports will be sent to your email the beginning of the each month with market statistics of the previous month.
For sellers I provide detailed price analysis report specific to each area or zip code and a complimentary no-obligation price analysis consultation.