This is June’s 2014 interactive report for Sebastian real estate market. This report is updated on a regular basis and provides an insight into Sebastian real estate market. You can subscribe to the Sebastian Home Values Real-Time Market Snapshot for more details and what’s going on right now in your neighborhood.
Sebastian Real Estate Market Highlights – May 2014
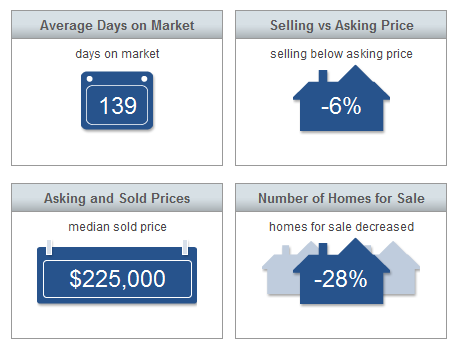
June 2014 was an active month for homes in Sebastian as the summer rolled in. The Inventory was further reduced by 28% which will bode well for more price appreciation as buyers have fewer homes to choose from. The Sebastian market statistics for June 2014 are summarized in the image below.
 DATA SOURCE: MLS data as of 7/2/2014. Data believed to be accurate but not guaranteed.
The following sections provide a comprehensive analysis of the Sebastian Real Estate Market. All charts are interactive and updated dynamically. Click on each chart picture below to see the latest market analysis chart.
Sebastian Real Estate Market Analysis – June 2014
Price Trend Analysis (Average List Price)
The history of sale prices the last 12 months can be seen in the charts below. The sale prices are increasing for single family homes and remain flat for condos. The sale prices for multi-family homes spiked in October of 2013 and have been declining up until January 2014, and have been stabilizing since then.
DATA SOURCE: MLS data. Data believed to be accurate but not guaranteed.
Want more information about the real estate market in your area?
Request a FREE Sebastian Real Estate Market Snapshot.
Price Trend Analysis (% Price Reduction)
The List (asking price) to Sale Price ratio is a useful statistic that shows the strength of a particular real estate market. It defines the sale’s price % of reduction from the asking price. The closer the sale price to list or asking price, the stronger the market is.
The following chart shows that single family homes and condos in Sebastian are selling with approximately 6% reduction or 94% List to Sale ratio, a very good ratio, which indicates that homes in Sebastian are price well and selling close to the market.
DATA SOURCE: MLS data. Data believed to be accurate but not guaranteed.
Want more information about the real estate market in your area?
Request a FREE Sebastian Real Estate Market Snapshot.
Days On the Market (DOM)
The Days On the Market (DOM) as illustrated in the chart below, is very useful because it can help us determine demand. A buyer’s market is indicated by high DOM. Consequently, a seller’s market is indicated by low DOM. The chart below shows that demand for Sebastian Real Estate has been steady but has slowed down during the summer months as the ascending DOM is indicating.
DATA SOURCE: MLS data. Data believed to be accurate but not guaranteed.
Want more information about the real estate market in your area?
Request a FREE Sebastian Real Estate Market Snapshot.
For sellers I provide detailed price analysis report specific to each neighborhood or zip code and a complimentary no-obligation price analysis consultation. Use the request form below and indicate that you wish to receive the detailed report and the no-obligation price analysis consultation.
Detailed Real Estate Market Reports for Sebastian real estate market are produced on a monthly basis. If you would like to receive up to date real-time market reports for your area, fill in the request form below.